

Three steps to creating an insight-driven digital marketing report
Monitoring, tracking and reporting on marketing campaigns is both an essential and valuable process that enables marketers to evaluate performance and understand what works, what could be improved and the overall impact on the business. Whilst reporting templates can be helpful, every business and campaign is different, and one size does not always fit all.

Download our Premium Resource – Measuring and reporting on client campaigns
Our guide shows you the building blocks of ‘data-driven marketing’, ensuring that data that is important to your client is captured in an effective manner across channels and campaigns for reporting.
Access the Measuring and reporting on client campaigns
Introducing key performance questions
In 2014, marketing consultant Bernard Marr felt that organizations were often jumping straight into designing indicators before being clear about what they really needed to know. As a response to this ongoing challenge, he introduced the concept of key performance questions (KPQs) to bridge the gap between strategic objectives and KPIs.
According to Marr:
“Formed as a short, forward-looking and open question that directly relates to a strategic objective, a KPQ enables senior leaders to fully understand what data and information they need in order to assess performance to that objective.”
Key performance questions allow you to take a step back and reflect on the overall goals and objectives you’re seeking to accomplish as part of your analytics reporting.
By starting with a KPQ, you can develop a very useful framework to structure your campaign measurement reports.
There are three steps to producing a KPQ-based measurement report.

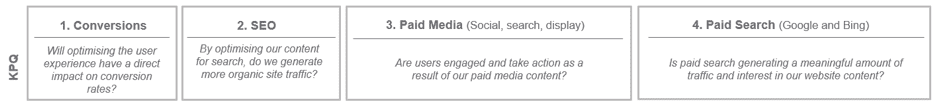
Step 1 – Key performance questions
From the beginning of the campaign process, bring together the core group of stakeholders involved to agree on what you’re looking to achieve. This exercise is useful as it will help you form a joined-up vision for the campaign and will inform your approach to measurement and reporting.
It’s useful to have five or six KPQs in total, so the kick-off session should be used to understand the questions stakeholders will be asking in order to judge the success of the campaign. For this type of meeting, ask people to bring along the following type of information:
- Business objectives (business group or division)
- Marketing objectives
- e.g. educate on product usage
- Campaign objectives
- e.g. promote webinar to educate prospects
Questions should be clear, simple and in plain language so everyone can understand. If you can get everyone on board and achieve consensus, you’ll have an aligned vision going forward.
Once all your objectives have been agreed, make a list of your KPQs against the different areas of activity you will be executing as part of the campaign.
Step 2 – Key performance indicators
The KPQs will provide an overarching view of what you’re looking to achieve. The next step is to consider what key performance indicators (KPIs) you believe relate best to each of the questions.
In the context of this report structure, a KPI is an indicator of the success of a question. As with objectives, KPQs have to be SMART and cannot be vague, and a strong set of KPIs will help keep you on track.
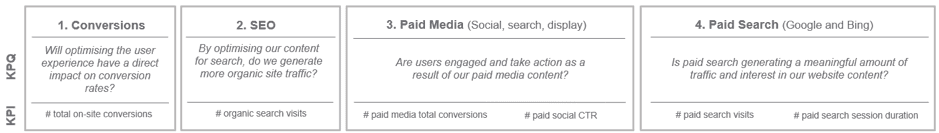
It’s common to see a whole host of different KPIs being used within a campaign report but, as with the KPQs, it’s much more effective to be selective about which KPIs you use. Go with those that you feel will give you the best opportunity to communicate how aspects of the campaign have performed.
In our example above we’ve gone with one KPI to ensure we really concentrate on delivering performance related to the KPQ. It may be that more KPIs are added at a later stage but for now, this one will focus the mind.
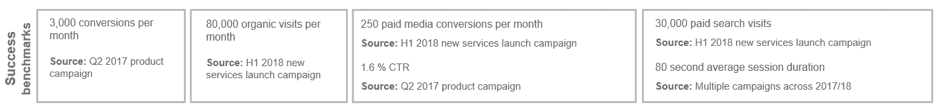
Step 3 – Success benchmarks
The final stage in the process is to consider what ‘good’ looks like. The success benchmarks help put the campaign’s performance into perspective and provide a meaningful target.
It’s useful at this stage to take a look at previous campaigns and make a judgement as to what worked previously, as well as what resonated with different stakeholders. For example, whilst the number of likes and comments may appeal to some members of the marketing team, senior management may not be as impressed, preferring instead more solid data around sales or revenue achievements.
Bringing it all together
Once all three areas are complete, the final one-page summary can come together, showing a clear link between the KPQs, KPIs and success benchmarks.
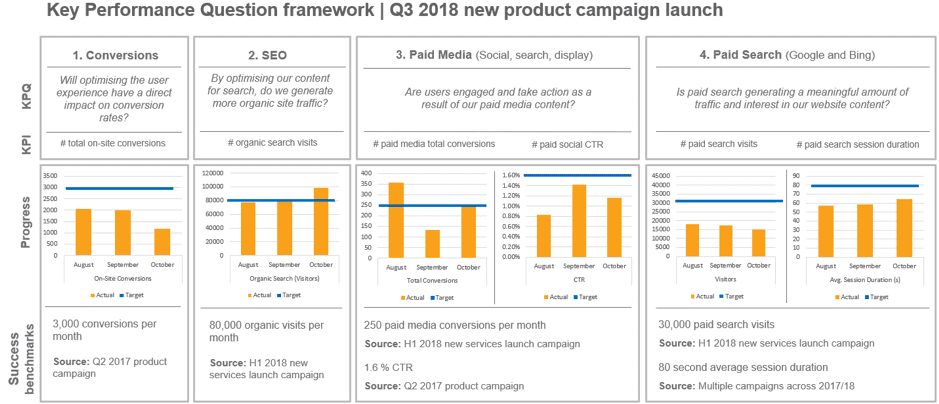
To provide additional clarity and information, consider adding in graphs/ tables to visually represent how different channels are performing/ have performed against your targets. This one-page dashboard should be able to summarise the campaign all on its own, with the rest of the report breaking these sections down into more detail.
Conclusion
The KPQ framework provides a useful structure in which to set a campaign performance report. The simplicity of the approach helps keep things simple and present data that can generate actionable insights and purposeful conversations about performance and next steps.
Our example provides a top-level overview, a dashboard to summarise the overall performance on one page. Commentary about each of the areas can be explored in more detail later in the report, however, this is also something that could be included within the one-pager, too. The example we’ve provided is only a template and there is scope to develop and refine this further based on your own brand and campaign objectives.