
Metrics are your marketing scorecard, which is why you need to ensure you’re tracking the right ones
Metrics are the ‘scorecard’ of your digital marketing work. When these metrics, also known as key performance indicators (KPIs), are moving upwards, you’re winning the marketing game. When they’re trending downwards, you’re on the losing team (at least for now).
You probably know your conversion-related KPIs by heart: metrics like conversion rate, revenue per visitor (RPV) and average order value (AOV). And on the acquisition side: cost per acquisition (CPA), return on ad spend (ROAS), and marketing qualified lead rate (MQL).

But, in order to get a clear sense of what matters most in your customers’ minds, you need to include customer experience (or ‘CX’) metrics in your scorecard mix. These CX metrics measure your prospects’ and customers’ perceptions of your brand, judged after several interactions, or ‘touchpoints,’ with both your online and offline marketing channels. They ultimately tell you whether your customers will come back to buy more, or start looking for another brand that will serve them better.
CX Metric 1: Net customer value growth
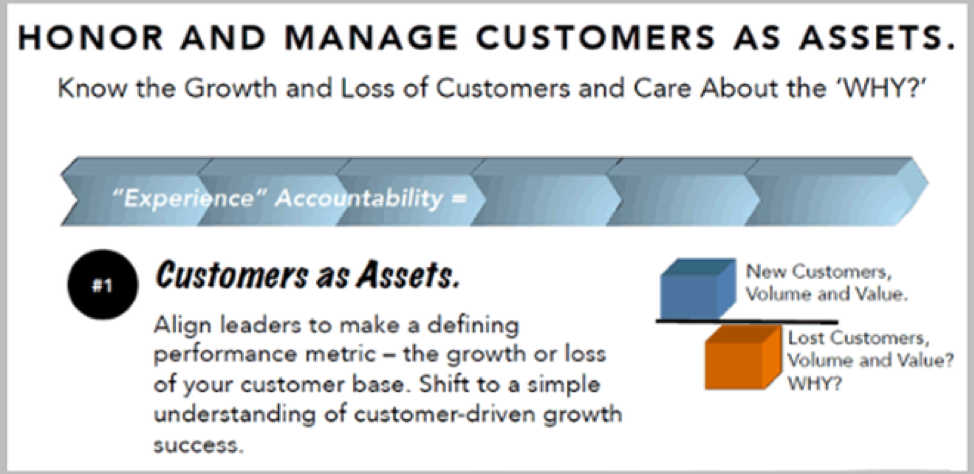
The most important CX metric in business is adding value – principally, bottom-line (profit) value to owners and shareholders. Knowing this, CX guru Jeanne Bliss defines the number one CX metric as ‘Net Customer Value Growth’ (NCVG). So, what does this mean?
NCVG is simply the difference between the number of new customers you added in a given time period, less the number of customers you lost during the same period. Importantly, it’s not just the net number of customers gained or lost, but the economic value of this customer growth or loss. That is:
Net Growth or Loss of Customer Asset =
New Customers (volume and value) – Lost Customers (volume and value)
It’s vital to show your customer asset metrics as whole numbers, not as retention rates so there’s a clear connection between the people and the math. Just talk percentages or scores and your executive team’s eyes will glaze over. But show how much your marketing, customer service and retention activities have grown the value of their stock, and you’ll soon see the eyes of your executive team, particularly your CFO, widen with excitement.
Why? Because this metric sees customers as what they really are: assets. Something that puts cash in the ‘accounts receivable’ column of your balance sheet every month. This metric reflects what they actually did versus what they said they would do in surveys. As we know, actions speak louder than words in the business world.
CX Metric 2: Net Promoter Score (NPS)
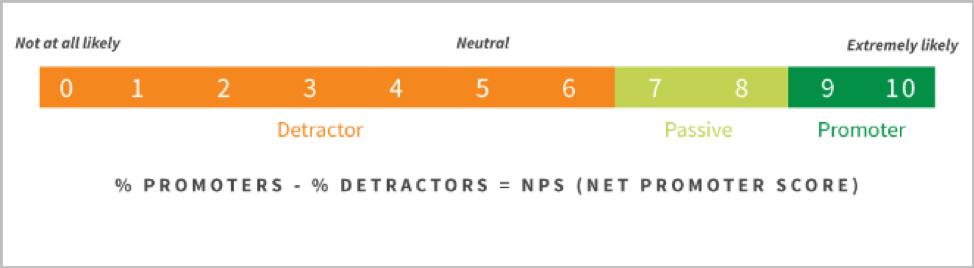
The net promoter score (NPS), originally created by Fred Reichheld, and now trademarked by SatMetrix™, is considered the core metric for customer experience management programs around the world. The reason: it’s simple to collect and calculate.
The graphic above shows the range of ‘promoter’ scores. Survey respondents are asked: ‘How likely is it that you would recommend [brand] to a friend or colleague?’ Only respondents who give a nine or ten are considered brand promoters; the others are detractors or passives.
Calculate your NPS as follows:
- Survey hundreds of your existing customers (the more you survey, the more accurate your scores will be).
- Tally the number of responses in each bucket (detractors, passives and promoters), then convert that to a percentage (of the total number of responses).
- Subtract the percentage of detractors from the percentage of promoters to get your NPS.
You’re looking for an NPS that’s greater than zero and preferably higher than 20%.
There is a downside to the NPS: it doesn’t tell you why your customers are dissatisfied or less-than-excited about your brand. This takes us to CX Metric number three, which is actually a set of behavior-based metrics.
CX Metric 3: Referrals from existing customers
Let’s take that NPS down another level: to the actual referrals your existing customers are giving to friends or colleagues. But first, here’s a little customer cost background.
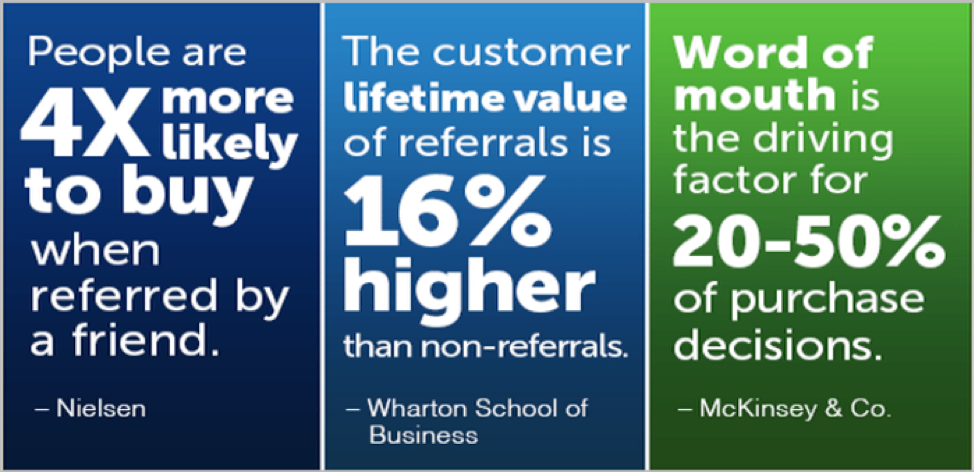
It costs a lot more to acquire and convert a new customer than it does to retain a current customer. One study found that it was five times as costly and a McKinsey and Co. study found that word of mouth was the driving factor in 20-50% of B2B purchase decisions. So it obviously pays to invest time in measuring and responding to customer attitudes about your brand.
Having worked as an account manager at a few digital agencies, I know that ‘willingness to refer us to prospective clients’ is the number one CX metric. If, after working with your agency for months or even years, a client isn’t willing — actually, eager — to recommend your agency to other clients, you’ve wasted a lot of time and effort. What’s more, these clients’ negative or neutral comments are likely lowering your referrals (and also your New Customer Value).
Some clients, when I mention the importance of tracking this metric, say ‘Um… I can’t get that.’ Well, to this I say, ‘you need to try harder to find a way to,’ because referral specifics are a crucial measurement of your customer experience.
Download our Free Resource – 10 common website customer experience mistakes
This guide reveals examples of poor website design from different sectors which are commonly seen, but best avoided.
Here are some ideas on how to get this referral data:
- For customers who give you an NPS of seven or higher, start tracking their social shares and other comments tied to their account (or email address).
- (For agencies) Have your account managers request referrals from clients at appropriate times (for example, two months into an engagement, and bi-monthly thereafter).
- (For companies) Have your customer service reps request referrals from customers under certain conditions, for example, after they have ‘touched’ your brand two or more times (be sure to track these touches in your customer-facing apps).
- Use text analytics to analyze sentiment on your social media accounts – mainly Facebook, Twitter and LinkedIn. These tools have algorithms that can gauge whether sentiment (feelings expressed) about your brand is mostly positive or negative. Learn more in the ‘Four Must-have Features for your Customer Listening Platform’ [insert link here] blog post by SmartInsights.
I’m sure there are other ideas you can come up with. My main point: gather your team and other people who regularly interact with your customers to discuss how to best to capture and track these referral events.
CX Metric 4: Behavior patterns that show strengthening or weakening of the customer relationship
As a digital marketer, your goal is to trigger positive emotions and even build new beliefs, in the minds of your customers. But, as I described for CX Metric number one, it’s actions that matter most. So what you’re really seeking are connections between visitor actions and the associated lead-generation and conversion implications of those actions.
For example, questions you might want to get answered include:
- Revenue and profitability by customer group or segments (customer segment movement). Are some of your customers moving upscale (to a higher-priced subscription, which is good), or downscale (bad)?
- What percentage of your customers did not sign up for a subscription (‘free trial offer’ scenario) or renew their subscription (‘customer subscription is ending’ scenario)?
- What percentage of your customers were lost after an incident? This is very powerful as it measures your customers’ perception of your company’s recovery.
It’s getting these answers, based on the data analyses leading up to them, that will best help you win at the digital marketing game.
Examples of insights per sales stage
Here are a few examples of valuable, analytics-based insights you can get at various stages in your sales cycle.
Key insight for the prospect acquisition and nurturing stage:
‘Prospects who viewed at least three content marketing pieces had a conversion rate (CR) 40% higher than prospects who didn’t.’
Key insight for the prospect conversion stage:
‘Prospects who engaged with online chat one or more times had a revenue per visitor (RPV) 230% higher than those who didn’t.’
Key insight for the customer retention stage:
‘Customers who didn’t have their support issue resolved on the first contact were five times more likely to churn.’
These insights are invaluable because they allow you to confidently change your marketing tactics or update your user experience to boost the factors that lift your performance metrics. In other words, they tell you which levers you should ‘pull on’ to drive KPI increases.
These customer insights can come from many sources, including:
- An Excel sheet statistical analysis of existing customer data.
- The reporting included in your visitor analytics or personalization platform.
- Your ‘big data’ analyses of prospect and customer behaviors based on your marketing creative, your internal data (e.g. CRM data, chat log data) and third-party data (e.g. social media-triggered ‘behaviors of value’).
These kinds of insights excite me and not just because they drive higher profits, but because they produce a more satisfying experience. Sounds like a win-win to me.
Recommendation: Hire an analytics geek
If you don’t already have someone who’s passionate about data and analytics on your team, consider hiring someone with that skill set, or bringing in an outside consultant. You’ll likely get an uber-high ROI on this investment.
This person doesn’t need to be a full-blown ‘data scientist’ (though that would be nice if you can afford one). But they should enjoy using a wide range of analytics tools (including Excel) and doing complex data queries. This person should also know a lot about predictive analytics.
Add CX metrics to your KPIs
In business and marketing, it’s the bottom-line performance that matters most. So it’s important that you choose the right metrics by which to judge this performance. It’s time to think beyond the traditional ‘inside-out’ marketing metrics to the ‘outside-in’ customer experience (CX) metrics that measure what your prospects and customers really think about your brand and how they behave as a result, so you’ll know how these attitudes affect the value of your brand.
Net customer growth, net promoter score and referrals are great CX metrics to start with, since they indicate how your customers judge your brand at a given time. But going forward we need to seek out the behavior-based data, analytics and insights that tell you how to confidentially tweak your marketing tactics to grow revenues, profits and value. By augmenting your own ideas, this analytics-based intelligence that will help you become the odds-on favorite in every digital marketing game you play.