
What’s a good average open rate for email? Read the best email statistics sources to benchmark your email campaigns in your industry sector
Email marketers often ask “how do our campaigns compare“? They’re looking for email statistics to compare subscriber engagement for open, clickthrough, delivery, unsubscribe and complaints rates, ideally within their sector. That’s what we cover in this regularly updated compilation of the best email marketing response statistics for different sectors and countries.
Fortunately, there are a number of good options to benchmark email response across different sectors. The best stats sources are compilations by email marketing service providers who produce statistics across their clients’ campaigns. We have grouped the stats into the four top questions asked:
For the most meaningful comparisons, we need to go beyond industry averages and drill down to the comparison of email types. For example, transactional emails such as a welcome sequence tend to have much higher interaction and click-through rates than a regular newsletter.

Email statistics – First 2020 update
We will continue to update these stats through 2020 as new reports are produced by the main email platforms which we link to show the latest open rates and clickthrough rates.
At the time of this update, many of the statistics are from the previous year, the Constant Contact and Mailchimp benchmarks are the most recent.
The benchmark statistics on email response vary depending on the types of email platform vendor used to send email. Lower-cost platforms tend to have SMB customers who are less well-known brands and this will mean that they have a different response from higher-cost enterprise email platforms which are better-known brands. We present both and provide links to the email providers so you can check to see if they have updated their data.
Q1. What are the email open and clickthrough rates for small to medium businesses?
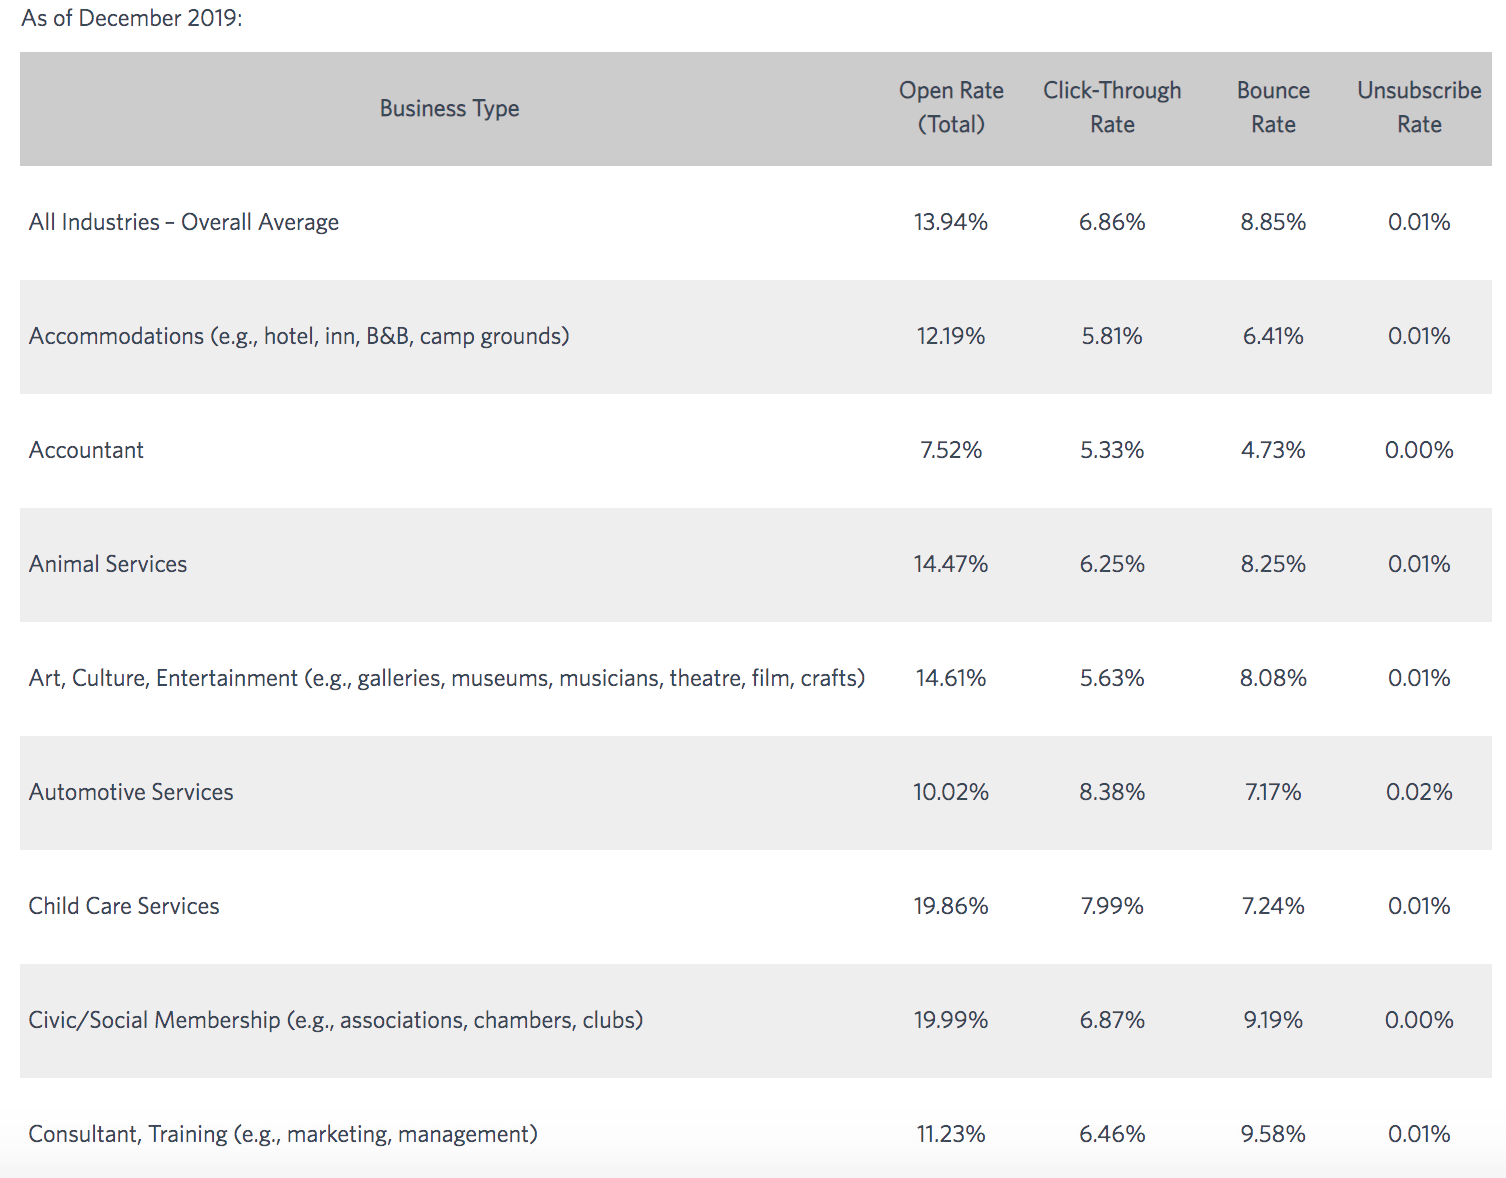
The most recent compilation at the moment is the December 2019 Constant Contact Average Email open and clickthrough rates by industry – click to expand. Interestingly, this shows the difference between mobile and desktop open rates.
Do contact us if you’re an email provider with recent stats to share. Talking of which… Mailchimp used to have monthly updates of their Email benchmark stats which give a great source of comparing email response by industry. However, their Email response data is now a little dated. It was last updated on October 2019.
| Industry | Average Open Rate | Average Click Rate | Hard Bounce | Soft Bounce | Unsubscribe Rate |
|---|---|---|---|---|---|
| All non-labeled accounts | 22.71% | 2.91% | 0.40% | 0.61% | 0.25% |
| Agriculture and Food Services | 23.31% | 2.94% | 0.32% | 0.50% | 0.28% |
| Architecture and Construction | 22.51% | 2.51% | 0.73% | 1.18% | 0.32% |
| Arts and Artists | 26.27% | 2.95% | 0.30% | 0.51% | 0.28% |
| Beauty and Personal Care | 16.65% | 1.92% | 0.26% | 0.33% | 0.30% |
| Business and Finance | 21.56% | 2.72% | 0.43% | 0.55% | 0.20% |
| Computers and Electronics | 19.29% | 2.08% | 0.47% | 0.79% | 0.27% |
| Construction | 21.77% | 2.26% | 0.86% | 1.28% | 0.39% |
| Consulting | 20.13% | 2.49% | 0.50% | 0.79% | 0.27% |
| Creative Services/Agency | 21.39% | 2.66% | 0.58% | 0.93% | 0.35% |
| Daily Deals/E-Coupons | 15.06% | 2.23% | 0.07% | 0.13% | 0.10% |
| E-Commerce | 15.68% | 2.01% | 0.19% | 0.26% | 0.27% |
| Education and Training | 23.42% | 2.90% | 0.32% | 0.51% | 0.21% |
| Entertainment and Events | 20.51% | 2.36% | 0.28% | 0.43% | 0.26% |
| Gambling | 21.62% | 3.30% | 0.42% | 0.38% | 0.15% |
| Games | 21.10% | 3.66% | 0.37% | 0.44% | 0.25% |
| Government | 28.77% | 3.99% | 0.33% | 0.50% | 0.13% |
| Health and Fitness | 21.48% | 2.69% | 0.30% | 0.40% | 0.40% |
| Hobbies | 27.74% | 5.01% | 0.18% | 0.31% | 0.23% |
| Home and Garden | 21.60% | 3.03% | 0.32% | 0.52% | 0.35% |
| Insurance | 21.36% | 2.13% | 0.67% | 0.71% | 0.25% |
| Legal | 22.00% | 2.81% | 0.52% | 0.66% | 0.22% |
| Manufacturing | 19.82% | 2.18% | 0.72% | 1.18% | 0.31% |
| Marketing and Advertising | 17.38% | 2.04% | 0.44% | 0.68% | 0.27% |
| Media and Publishing | 22.15% | 4.62% | 0.14% | 0.27% | 0.12% |
| Medical, Dental, and Healthcare | 21.72% | 2.49% | 0.51% | 0.63% | 0.28% |
| Mobile | 19.29% | 2.27% | 0.48% | 0.58% | 0.37% |
| Music and Musicians | 21.88% | 2.94% | 0.28% | 0.48% | 0.26% |
| Non-Profit | 25.17% | 2.79% | 0.33% | 0.49% | 0.20% |
| Pharmaceuticals | 18.58% | 2.25% | 0.39% | 0.53% | 0.17% |
| Photo and Video | 23.24% | 3.23% | 0.43% | 0.65% | 0.40% |
| Politics | 22.94% | 2.37% | 0.28% | 0.41% | 0.21% |
| Professional Services | 21.94% | 2.55% | 0.56% | 0.83% | 0.31% |
| Public Relations | 21.02% | 1.98% | 0.45% | 0.71% | 0.17% |
| Real Estate | 19.17% | 1.77% | 0.38% | 0.56% | 0.27% |
| Recruitment and Staffing | 21.14% | 2.53% | 0.45% | 0.53% | 0.30% |
| Religion | 27.62% | 3.16% | 0.17% | 0.25% | 0.15% |
| Restaurant | 19.77% | 1.34% | 0.37% | 0.50% | 0.28% |
| Restaurant and Venue | 20.39% | 1.40% | 0.32% | 0.45% | 0.39% |
| Retail | 18.39% | 2.25% | 0.22% | 0.32% | 0.25% |
| Social Networks and Online Communities | 21.06% | 3.32% | 0.20% | 0.34% | 0.22% |
| Software and Web App | 21.29% | 2.45% | 0.65% | 0.97% | 0.37% |
| Sports | 24.57% | 3.09% | 0.26% | 0.39% | 0.28% |
| Telecommunications | 20.92% | 2.27% | 0.63% | 0.87% | 0.23% |
| Travel and Transportation | 20.44% | 2.25% | 0.31% | 0.51% | 0.24% |
| Vitamin Supplements | 15.03% | 1.62% | 0.23% | 0.36% | 0.27% |
| Average Totals | 21.33% | 2.62% | 0.40% | 0.58% | 0.26% |
Note: This table is only available when not signed in to the member area.
We do have other industry sector breakdowns of response later in this post, but since GetResponse, Constant Constant and Mailchimp send billions of emails a month for more than 10 million users this is probably the largest global sample of email response that has been created. They are skewed to smaller businesses using their free account options, though.
Our content partner GetResponse regularly publishes email response benchmarks. The most recent GetResponse Email marketing benchmarks for Q2 2019 gives a worldwide average of open and clickthrough rates by country and by sector. This gives one of the best sources for comparing email response statistics by region.
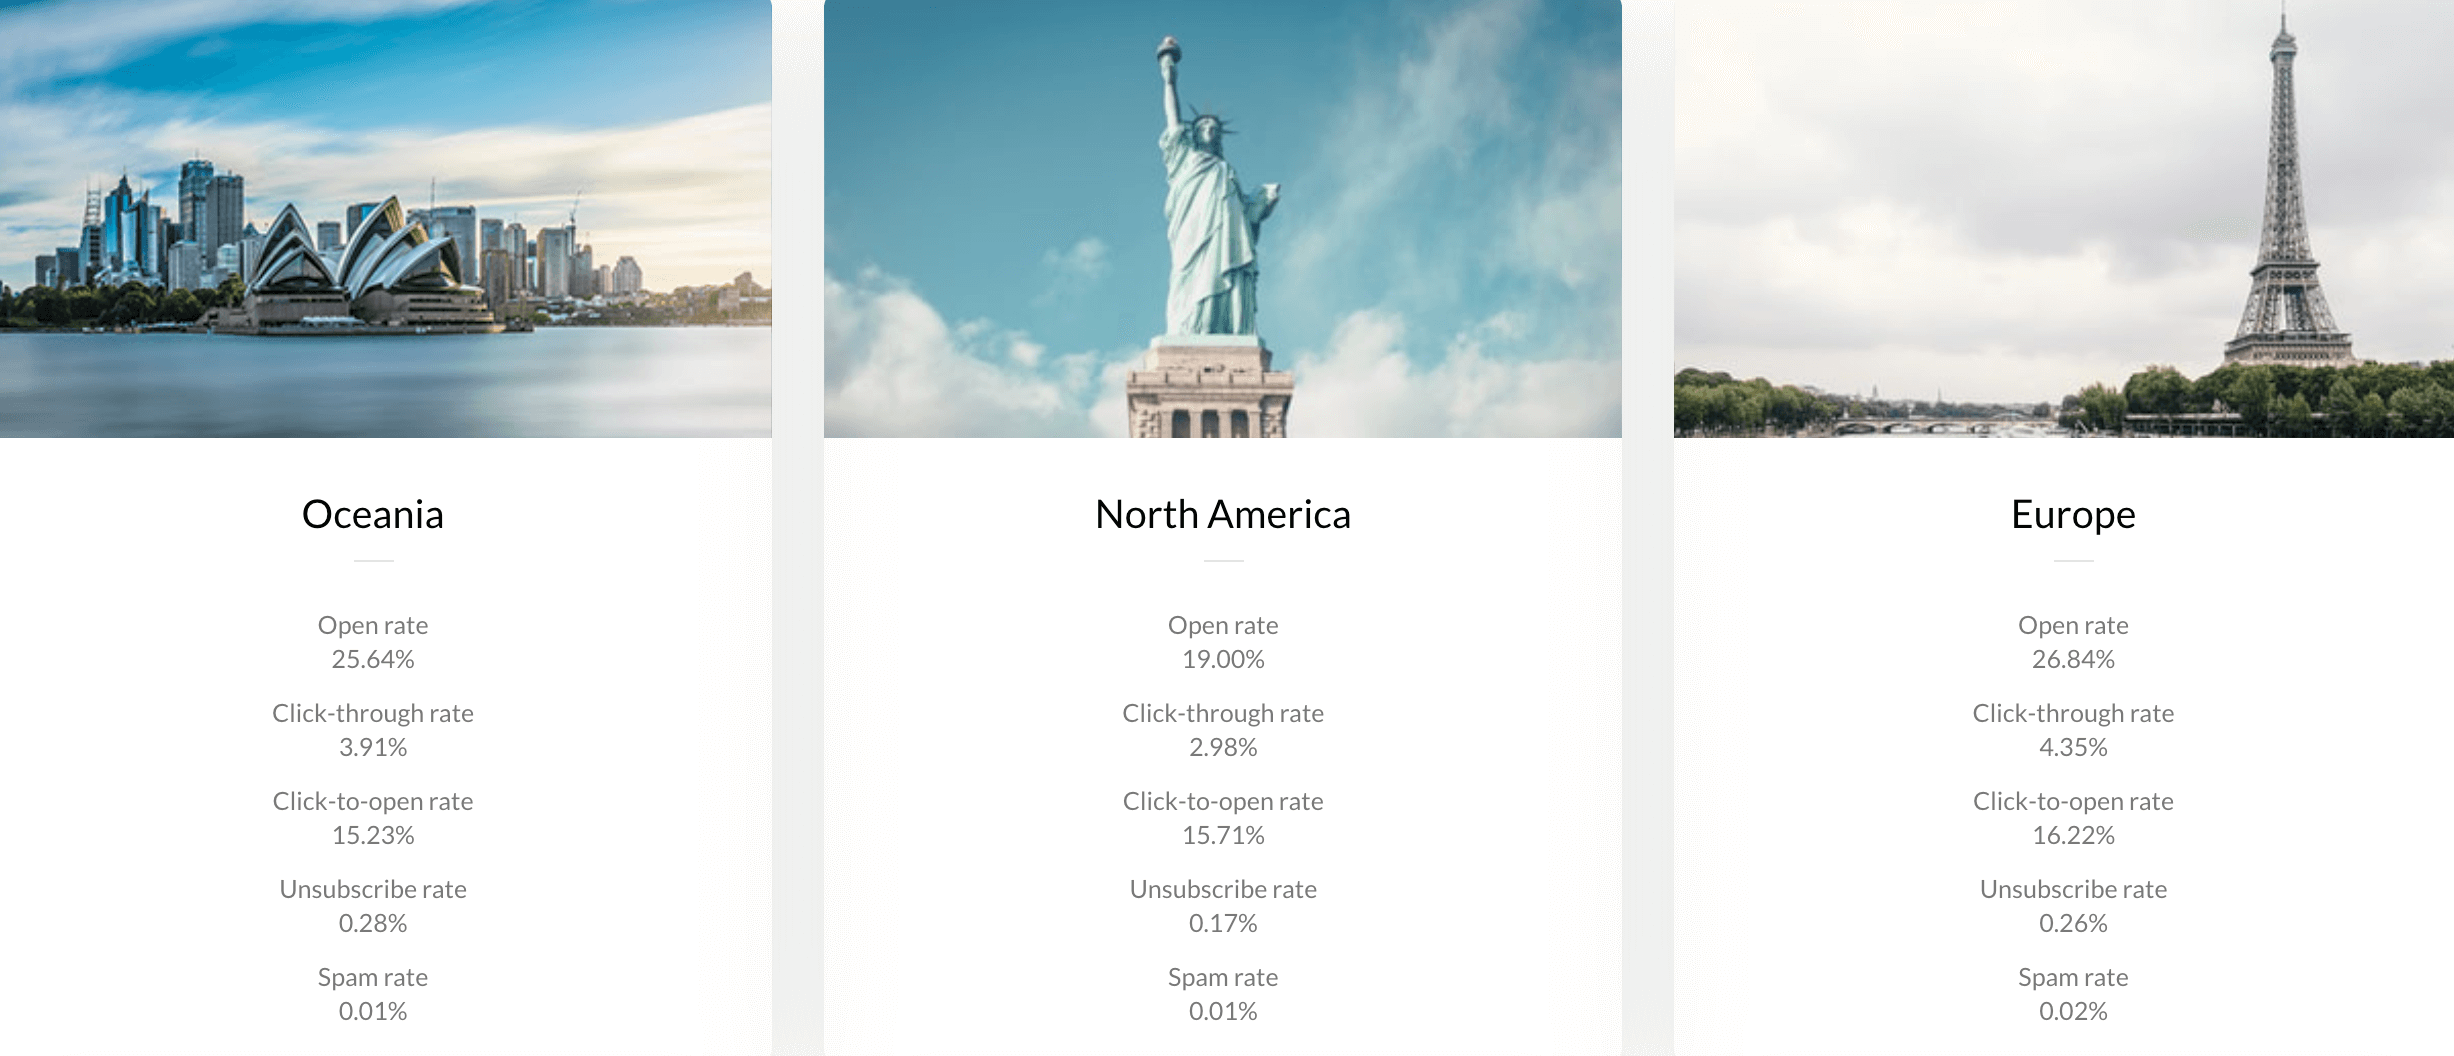
Here is the sector summary which also includes unsubscribe and spam rates in the full report (Click to expand).
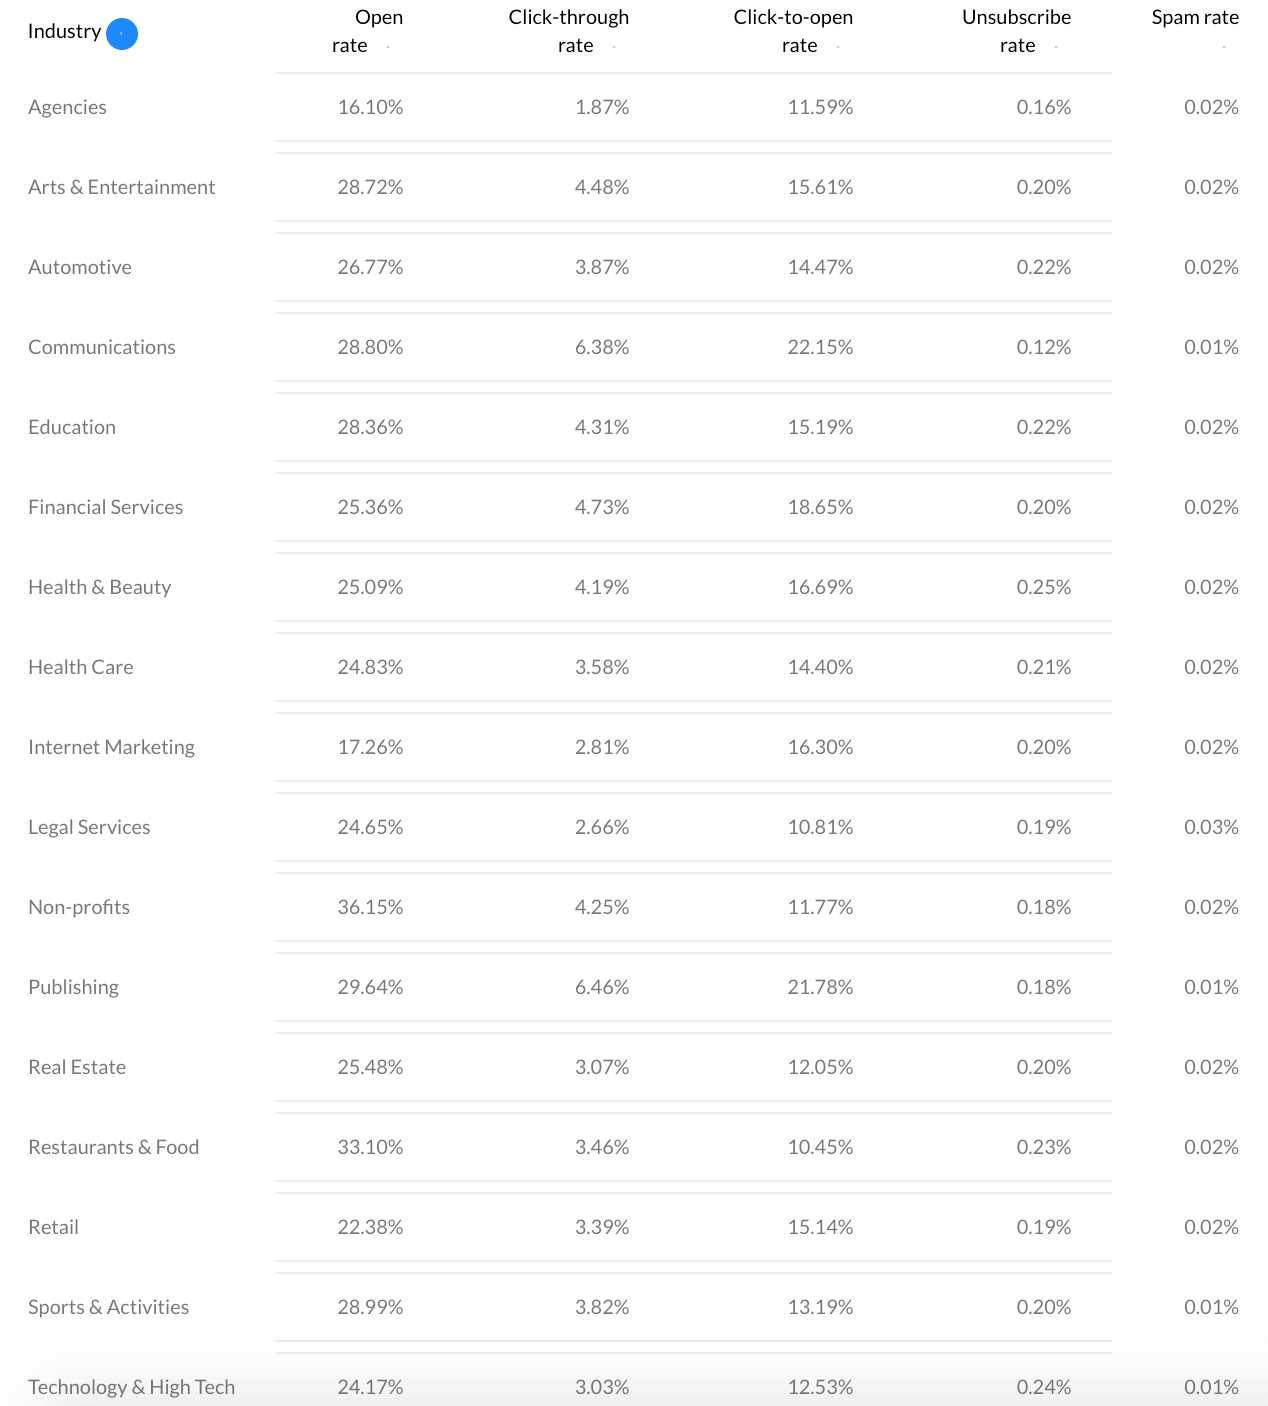
It’s a useful report because it has the breakdown of opens, clicks and unsubscribes by industry for B2B and B2C markets. This shows the much lower response in some sectors such as Events, Education, and Legal Services.
Q2. What are the email engagement rates for larger businesses?
The results for Getresponse, Constant Contact and Mailchimp are more typical of smaller and mid-size businesses, rather than large brands.
The UK Direct Marketing Association (DMA) have released their latest Email marketing benchmark report with partner dotDigital (October 2019 report using a compilation of data from the previous year).
The benchmark data from this report, shows that far from the oft-reported ‘death-of-email’, responses to email have been fairly constant over the past few years.
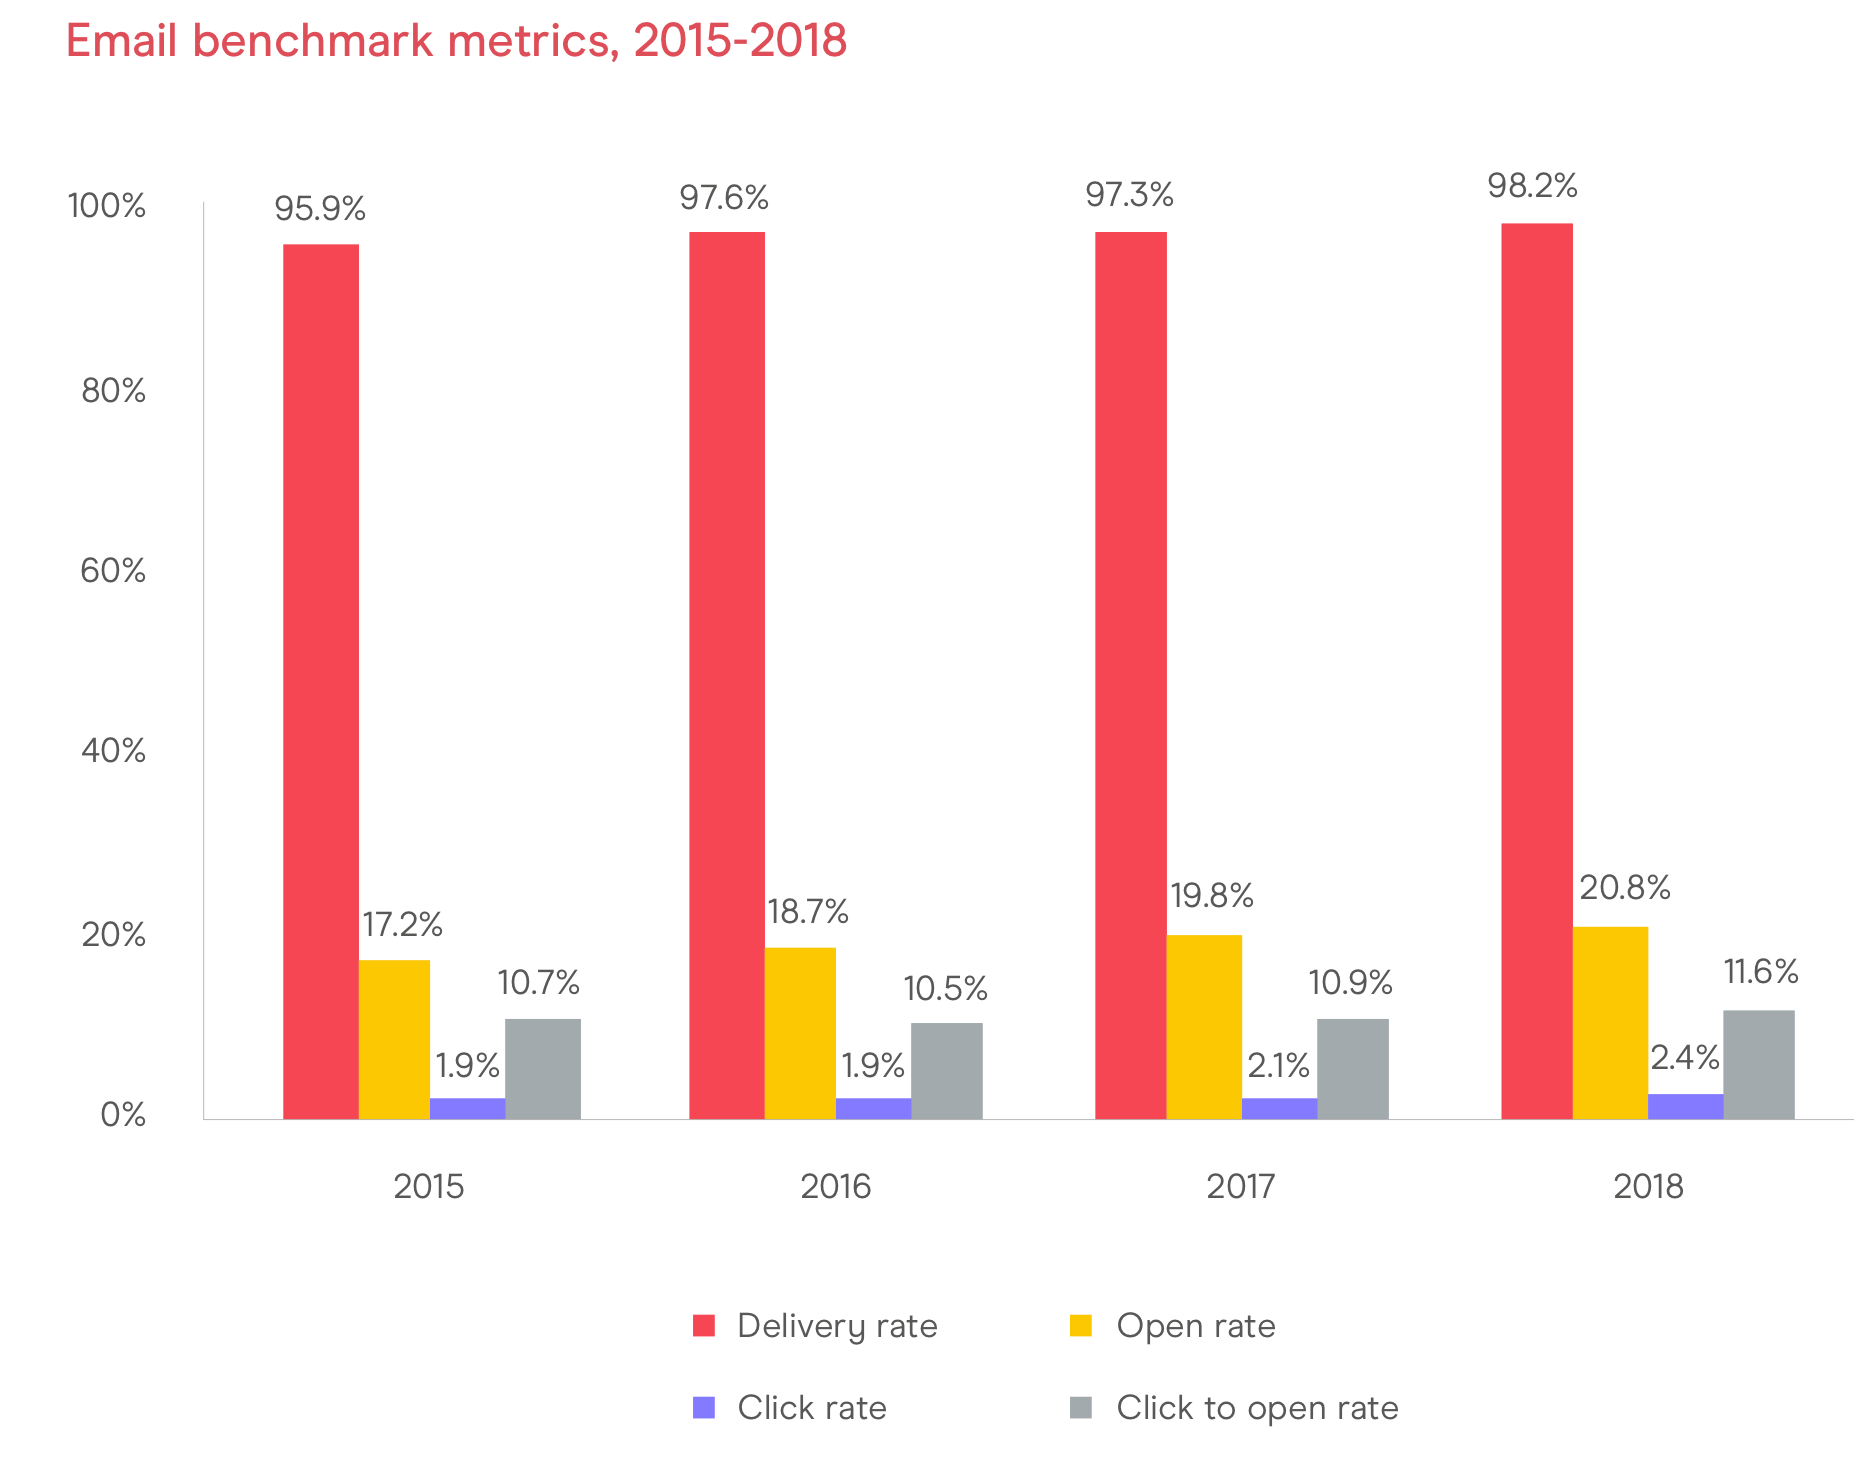
Note that the sample for this report is representative of medium-to-large Email service providers mainly based in the UK including. It covers over 35 billion emails sent in the previous year by nine different ESPs: Dotdigital, Epsilon, Itg, Mapp Digital, Moosend, Pure360, RedEye, Zeta Global and ZeroOne. The improvement in all four metrics suggests improved use of email delivery and targeting practices to improve performance.
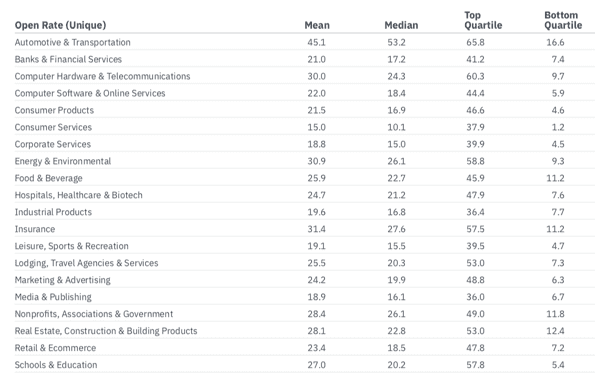
This Email benchmark compilation from IBM has enterprise clients tend to represent larger businesses – they are from 750 companies representing 3,000 brands in 40 countries. So breakdowns by EMEA, UK, US and APAC are available too. I’ve selected the breakdown by industry which is more useful to compare your performance with. There wasn’t an update since the takeover, but we’re hoping for an update in the stats this year.

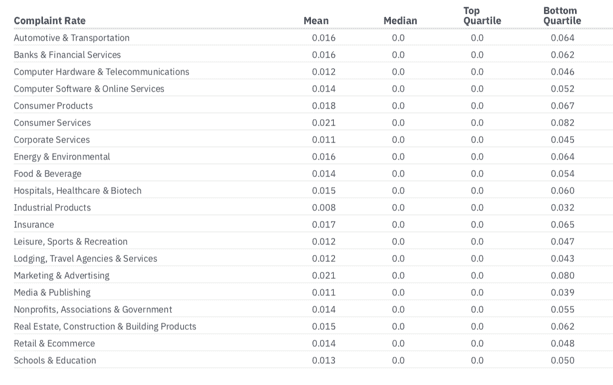
But what is the average email open rate? Here are the open rates with the mean showing the variation from the poorest performing sectors like publishing and tech to consumer brands and non-profits.
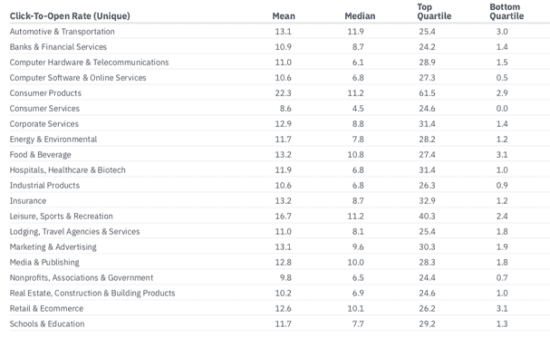
Rather than click-through rates that are also available in the report, I have picked out Click-to-open which shows engagement with the copy and creative. As a rule of thumb you should look for 10 to 15% CTOR, so can compare emails against this benchmark.
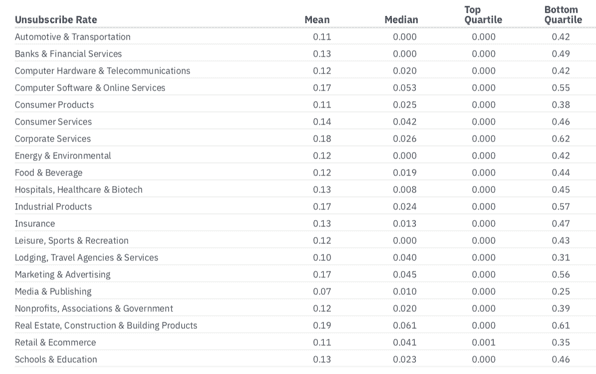
Finally, from this benchmark, I thought it would be useful to share the data on list churn as indicated by hard bounce rates and spam complaint rates. You don’t want to go too high on these since you could have a problem with inbox delivery and likely your ESP will get in touch.
Q3. What is the breakdown of market share for email clients on mobile and desktop?
Litmus, one of the best sources for stats on email marketing regularly produce a summary of reading environments and email clients.
This chart summarizing their research shows the rise of mobile email marketing to the point that nearly half of emails are opened on smartphones and tablets.
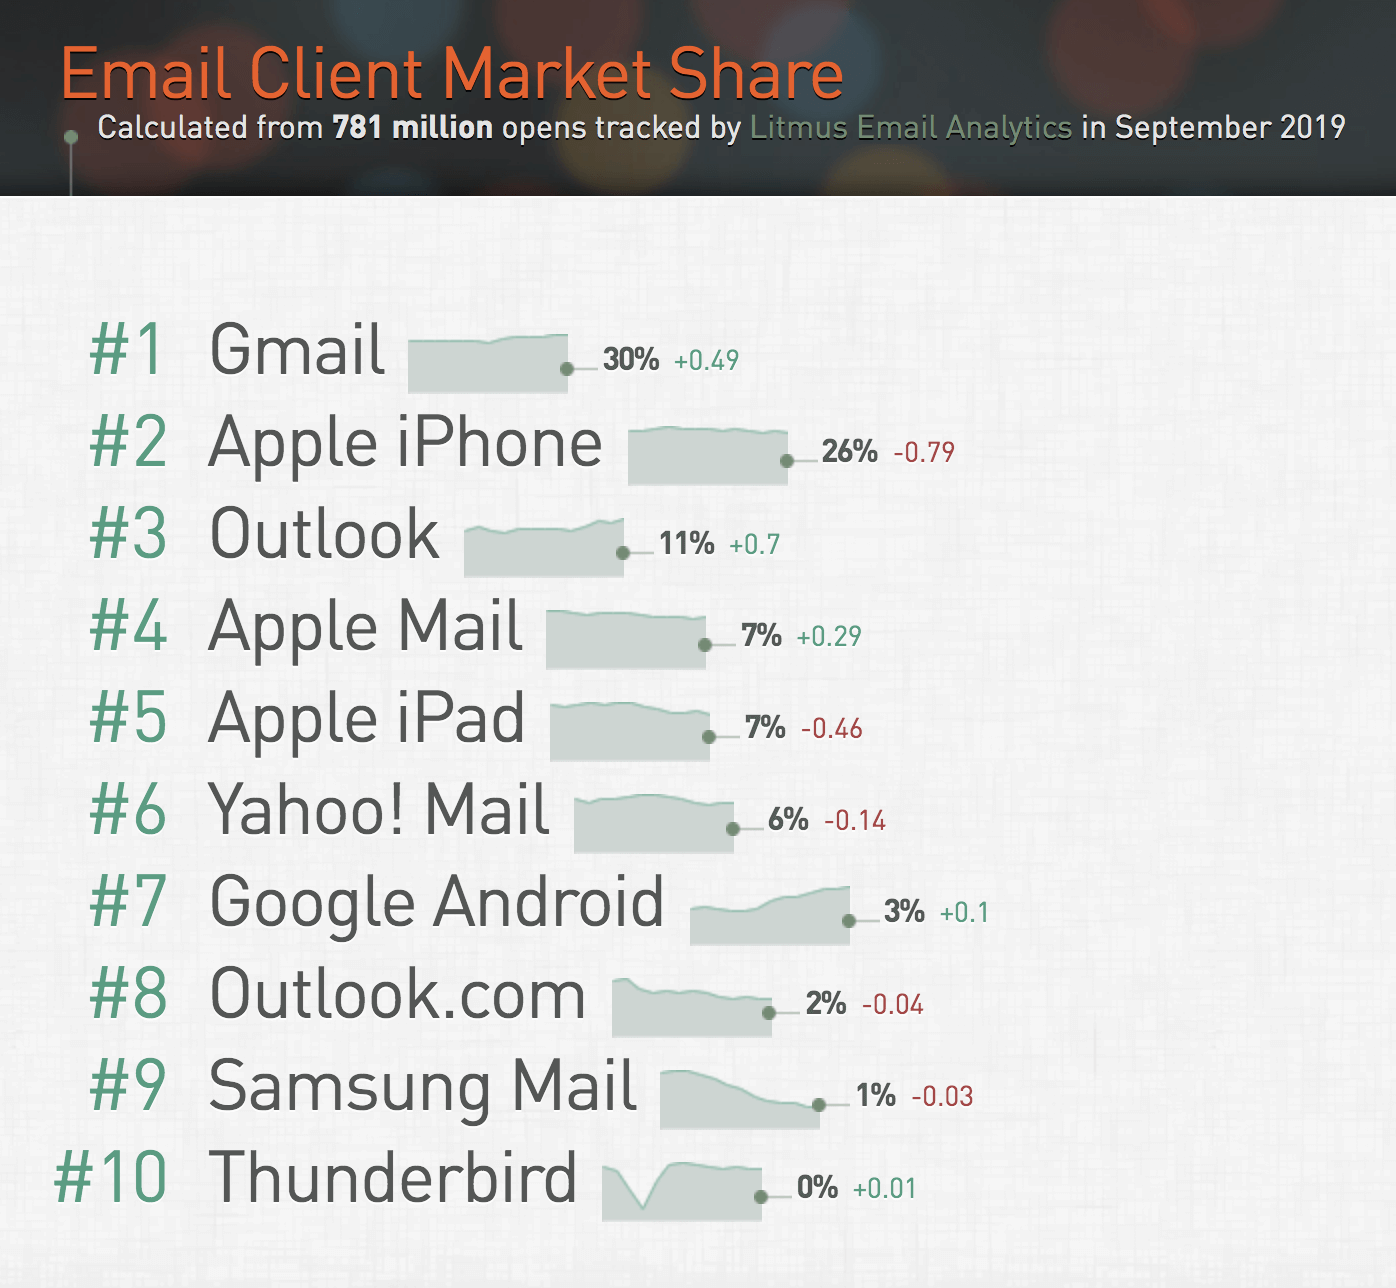
The latest Litmus compilation of email client market share shows why it’s so important to consider how well your emails render on mobile. It’s based on the percentage of opens on different platforms.
Q4. What is a good open and clickthrough rate? How do these differ for different industries?
Although we are presenting averages in this article, to answer this question it’s important to go beyond averages in your analysis of your email marketing so you can compare ‘apples with apples’. It’s worth segmenting your email response in this way:
- By email type (see below)
- By offer type
- By audience demographics
This will give you a better indication of performance as will analysis by revenue per 1000 emails sent. To show the difference of email type, the GetResponse Email marketing benchmarks include these averages by email opens – click here to see the latest.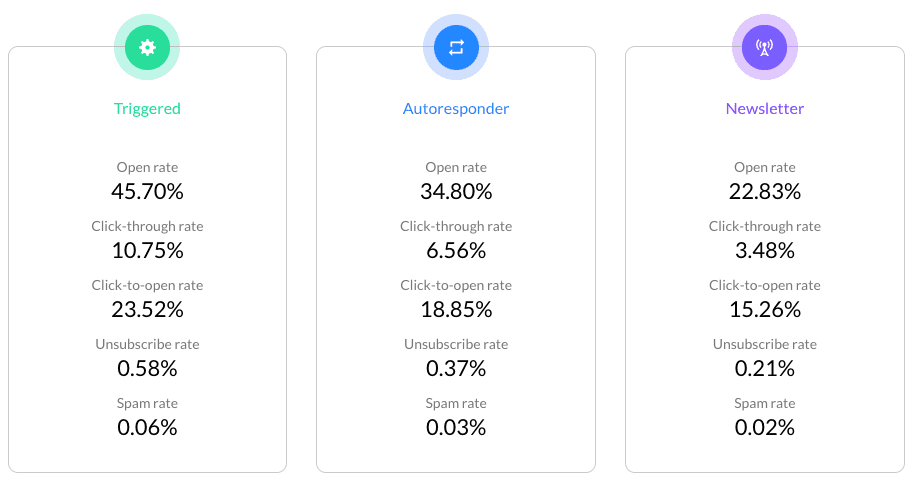 It’s no surprise that triggered and autoresponder (welcome) emails have higher open and click rates since they are more relevant or immediate, more in the context of an action that a subscriber has taken. It shows the power of marketing automation.
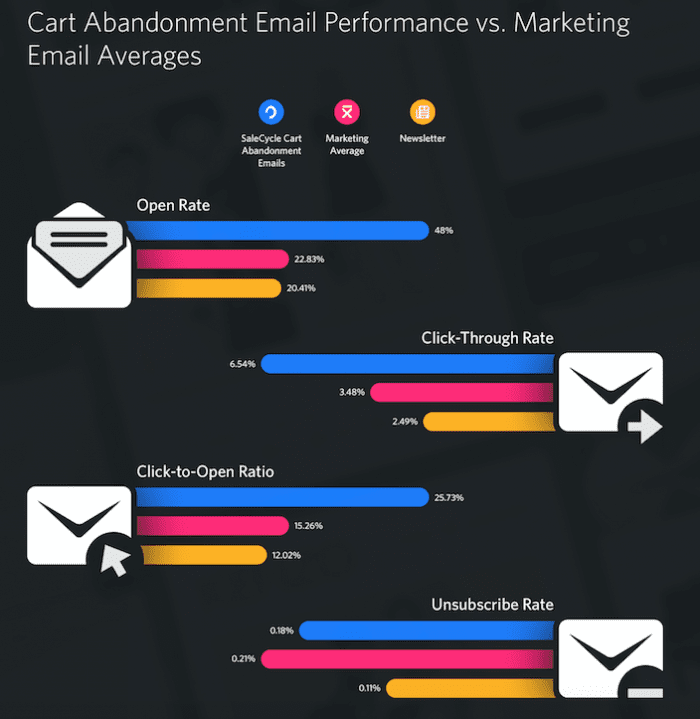
Sales Cycle also has some good insight showing response rates for remarketing emails like basket abandons compared to other types of emails in their Remarketing report.