
Examples of using the BCG Matrix (Growth Market Share Matrix) to review your product portfolio
What is the BCG Matrix?
The Boston Consulting group’s product portfolio matrix (BCG matrix) is designed to help with long-term strategic planning, to help a business consider growth opportunities by reviewing its portfolio of products to decide where to invest, to discontinue or develop products. It’s also known as the Growth/Share Matrix.
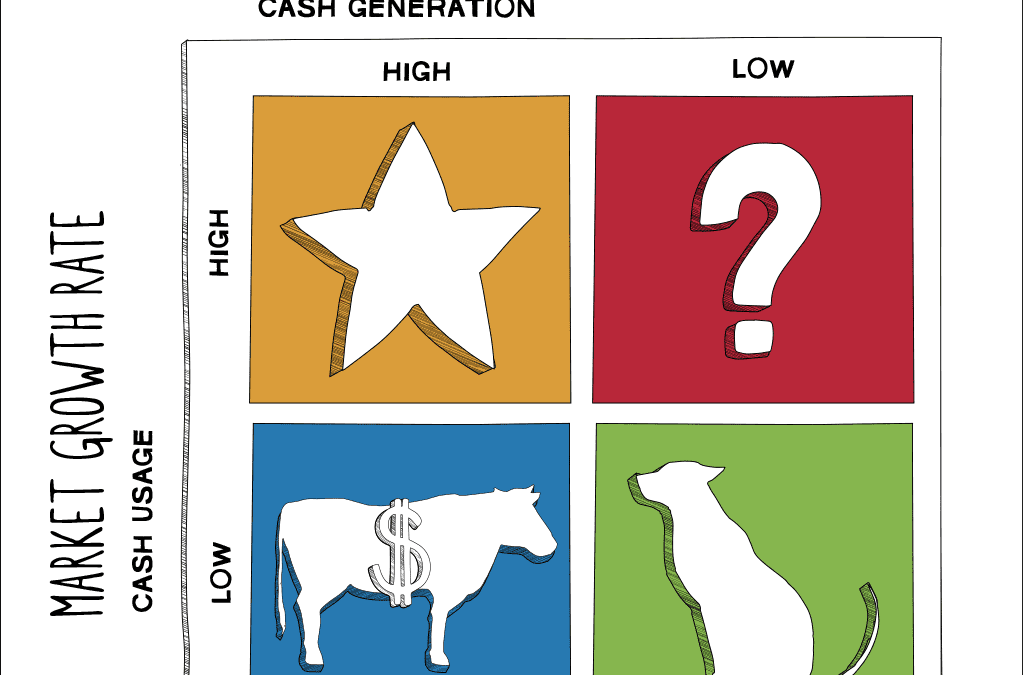
The Matrix is divided into 4 quadrants based on an analysis of market growth and relative market share, as shown in the diagram below.
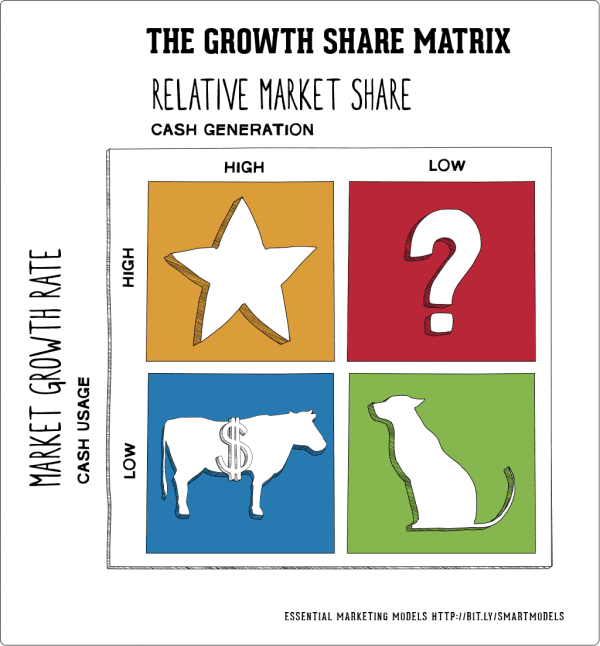
- 1. Dogs: These are products with low growth or market share.
- 2. Question marks or Problem Child: Products in high growth markets with low market share.
- 3. Stars: Products in high growth markets with high market share.
- 4. Cash cows: Products in low growth markets with high market share
Members can use our guide exploring classical marketing models to learn more about how to apply them to real-world challenges. We also have a free guide for more recent digital marketing models including our Smart Insights RACE digital marketing planning framework.

Download FREE Resource – Essential marketing models
15 classic planning tools to inform strategy development.
Access the Essential marketing models
How to use the BCG Matrix?
To apply the BCG Matrix you can think of it as showing a portfolio of products or services, so it tends to be more relevant to larger businesses with multiple services and markets. However, marketers in smaller businesses can use similar portfolio thinking to their products or services to boost leads and sales as we’ll show at the end of this article.
Considering each of these quadrants, here are some recommendations on actions for each:
- Dog products: The usual marketing advice here is to aim to remove any dogs from your product portfolio as they are a drain on resources.
However, this can be an over-simplification since it’s possible to generate ongoing revenue with little cost.
For example, in the automotive sector, when a car line ends, there is still a need for spare parts. As SAAB ceased trading and producing new cars, a whole business emerged providing SAAB parts.
- Question mark products: As the name suggests, it’s not known if they will become a star or drop into the dog quadrant. These products often require significant investment to push them into the star quadrant. The challenge is that a lot of investment may be required to get a return. For example, Rovio, creators of the very successful Angry Birds game has developed many other games you may not have heard of. Computer games companies often develop hundreds of games before gaining one successful game. It’s not always easy to spot the future star and this can result in potentially wasted funds.
- Star products: Can be the market leader though require ongoing investment to sustain. They generate more ROI than other product categories.
- Cash cow products: The simple rule here is to ‘Milk these products as much as possible without killing the cow! Often mature, well-established products. The company Procter & Gamble which manufactures Pampers nappies to Lynx deodorants has often been described as a ‘cash cow company’.
Use the model as an overview of your products, rather than detailed analysis. If market share is small, use the ‘relevant market share’ axis is based on your competitors rather than entire market.

BCG Matrix Example: How it can be applied to digital marketing strategies?
The BCG Model is based on products rather than services, however, it does apply to both. You could use this if reviewing a range of products, especially before starting to develop new products.
Looking at the British retailer, Marks & Spencer, they have a wide range of products and many different lines. We can identify every element of the BCG matrix across their ranges:
Example: Lingerie. M&S was known as the place for ladies underwear at a time when choice was limited. In a multi-channel environment, M&S lingerie is still the UK’s market leader with high growth and high market share.
- Question Marks/Problem Child
Example: Food. For years M&S refused to consider food and today has over 400 Simply Food stores across the UK. Whilst not a major supermarket, M&S Simply Food has a following which demonstrates high growth and low market share.
Example: Classic range. Low growth and high market share, the M&S Classic range has strong supporters.
Example: Autograph range. A premium-priced range of men’s and women’s clothing, with low market share and low growth. Although placed in the dog category, the premium pricing means that it makes a financial contribution to the company.
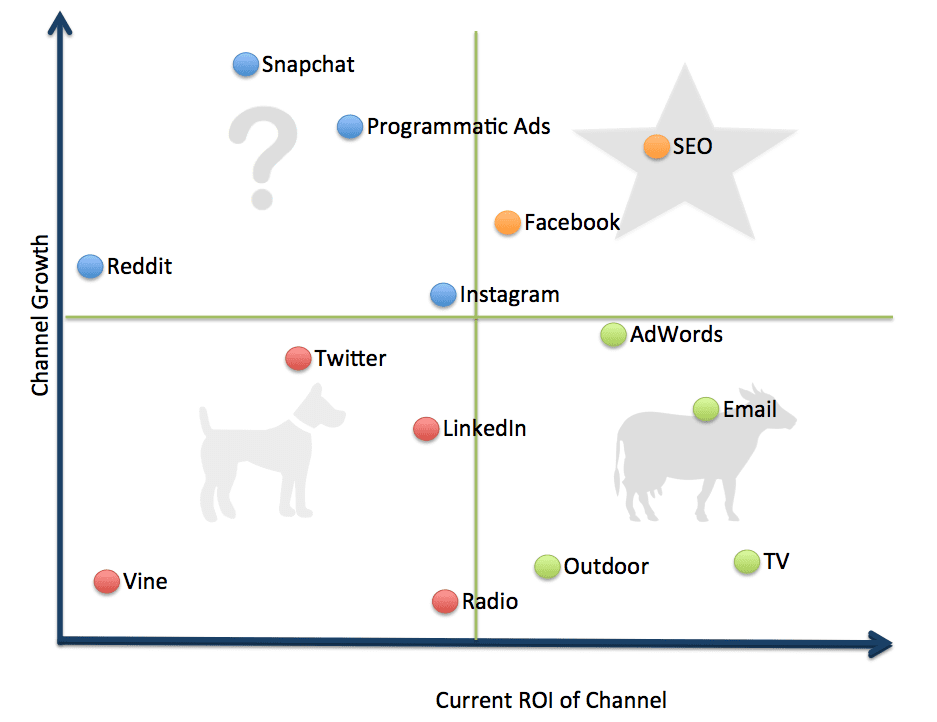
You can also apply the BCG model to areas other than your product strategy.
For example, we developed this matrix as an example of how a brand might evaluate its investment in various marketing channels. The medium is different, but the strategy remains the same- milk the cows, don’t waste money on the dogs, invest in the stars and give the question marks some experimental funds to see if they can become stars.
Other more tactical uses of matrixes to support your digital marketing strategy development include the Smart Insights :
What to watch for?
The BCG Model is seen as simplistic and it can be difficult to classify products in smaller businesses where the relative market share is too small to quantify. It’s also based on the concept that market share can be achieved by spending more on the marketing budget.
Original Sources
Barksdale, H. C. and Harris Jr., C. E. (1982). Portfolio Analysis and the Product Life Cycle. Long Range Planning. (Vol. 15 Issue 6). p74-83.